Accessing Activity Statistics
You can access the activity statistics through the user panel in the lower left corner of the interface. Click on your profile name or email address to open the user panel, then select “Statistics” to view your activity data.Available Metrics
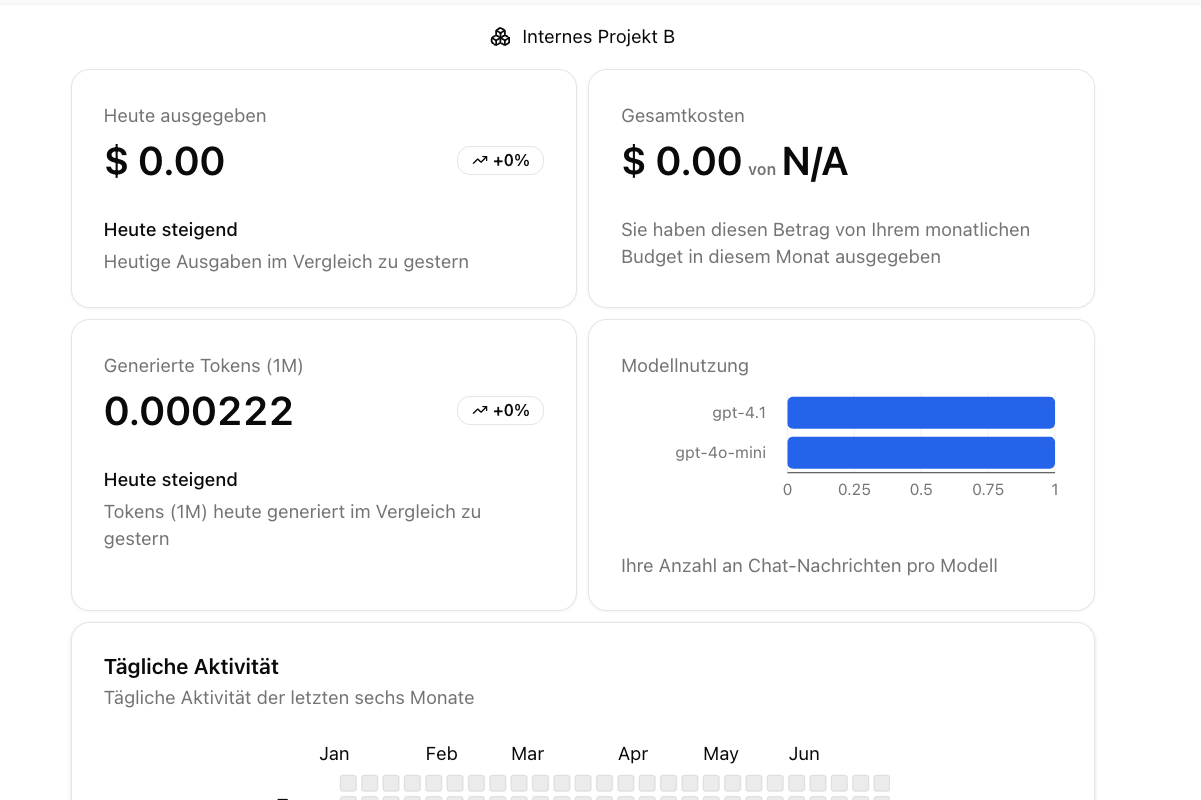
The activity statistics dashboard provides various metrics at different organizational levels:Individual User Level
Personal Usage Metrics
Personal Usage Metrics
- Total Chat Sessions: Number of initiated chat interactions
- Query Volume: Number of queries submitted to the system
- Document Uploads: Number and size of documents you have uploaded
- Model Usage Distribution: Breakdown of AI models you have used
Productivity Metrics
Productivity Metrics
- Feature Usage: Which features you use most frequently
- Peak Usage Times: When you are most actively using the system
Organization Level
Company Overview
Company Overview
- Total Active Users: Number of employees regularly using BusinessGPT
- Organization-wide Engagement: Overall platform adoption metrics
- Department Comparison: Usage patterns across different departments
Visualization Options
The statistics dashboard offers several visualization options to help you understand the data:Time-Based Views
- Daily Activity: Track usage patterns throughout the day
- Weekly Trends: Identify peak usage days and patterns
- Monthly Reports: Monitor longer-term trends and growth
Export and Sharing
You can export activity statistics in various formats:- PDF Reports: Comprehensive activity summaries
- CSV Data: Raw data for further analysis in spreadsheet applications
Next Steps
Now that you know how to track and analyze user activities, discover how to:Workspaces
Organize your work in dedicated areas
Knowledge Base
Create and manage collaborative knowledge bases